Close

As explained in previous posts (ERA6 Reanalysis. Prologue and ERA6 Reanalysis Key Improvements, the new reanalysis ERA6 is expected to be released by the end of 2026. So far, the European Center for Medium-Range Weather Forecasts (ECMWF) has released two preliminary test batches: one covering three months (June to August 2022) and another spanning seven months (October 2019 – April 2020). These datasets are still a prototype, so any insights derived from them should be considered early-stage, not final conclusions.
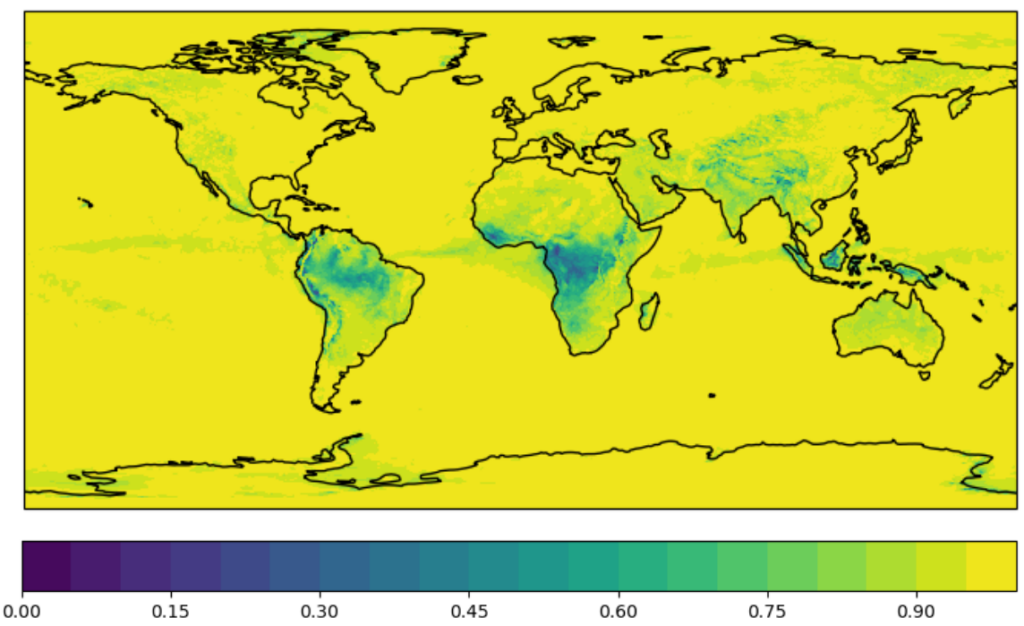
Before using any WRF simulations, ERA5 and ERA6 were compared at the 100 m surface level. The plot below shows the R² coefficient for the daily wind speed correlation between the two datasets. In general, agreement is high, though some differences appear in areas with complex topography or consistently low wind speeds.
Both ERA5 and ERA6 datasets were dynamically downscaled using WRF to assess performance differences. Reanalysis data were used as initial and boundary conditions. Land cover data were sourced from the 300 m-resolution Globcover database (European Space Agency) which was used to quantify roughness length and albedo. Elevation data came from NASA’s 90 m-resolution SRTM topography.
Nested domains with a 3:1 ratio were used to achieve a final resolution of 3 km. The output time series are not simple interpolations but full WRF dynamic downscaling.
The same WRF setup was applied to both ERA5 and ERA6 3D datasets. Simulations were run across 1,000 locations with a relevant wind resource, distributed in 40 countries. Validation was done against on-site observations, where available.
The ERA6 reanalysis surface was not validated directly against observations, as it only includes 10m and 100m levels. No height extrapolation (e.g. using power-law wind profiles) was applied to avoid introducing additional uncertainty to the analysis.
| ERA5 | ERA6 | |
|---|---|---|
| Hourly R² | 0.71 | 0.72 |
| BIAS (%) | 8.13 | 8.15 |
Differences are minor overall. ERA6 shows a slight improvement in correlation, while the bias remains similar. For deeper insight, results were analyzed at the country level.
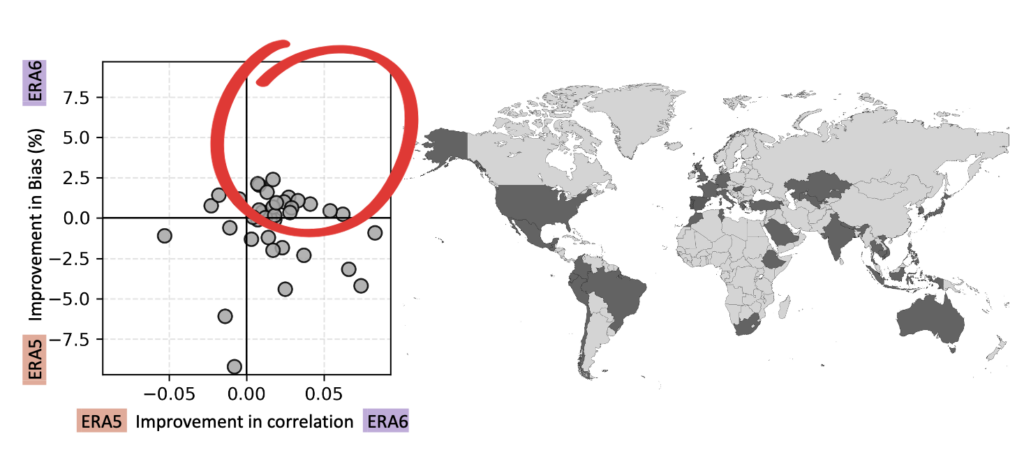
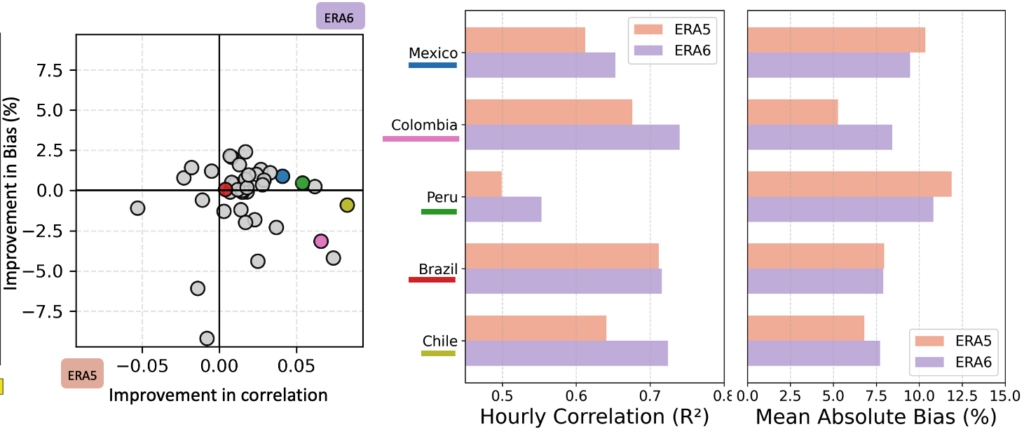
The figure below shows the results for all 40 countries in terms of hourly correlation and Mean Absolute Bias against observations. Each dot represents a country.
The horizontal axis represents the improvement in the R² coefficient; if a dot is on the right, it means that ERA6 correlates better than ERA5 with observations. The vertical axis shows the improvement in the Mean absolute bias. Countries above the line have lower bias with ERA6 than with ERA5 against observations.
Ideally, countries in the upper-right quadrant represent cases where ERA6 performs better than ERA5.
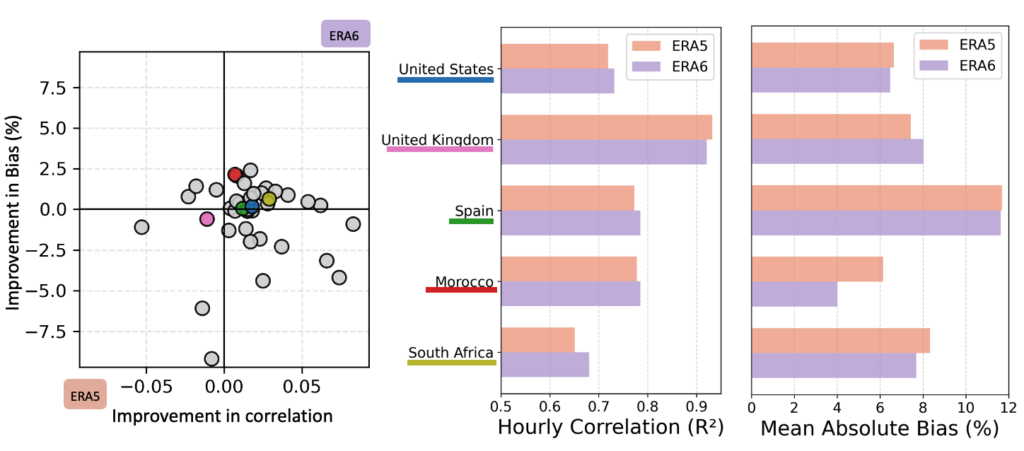
Zooming into regional comparisons, for the North Atlantic and Africa, improvements are more evident. The bar chart on the right shows the comparison between ERA5 (pink) and ERA6 (violet) for both hourly correlation and Mean Absolute Bias.
Most countries fall in the upper-right quadrant, meaning ERA6 improves over ERA5 in both metrics. The UK is a notable exception, where ERA6 slightly underperforms ERA5 in both correlation and bias.
In Latin America, ERA6 shows clear improvement in correlation, particularly in Chile and Colombia. However, these improvements come with a slight increase in bias. In contrast, México and Perú show improvements in both correlation and bias, which is encouraging. Brazil remains mainly the same for ERA6 and ERA5.
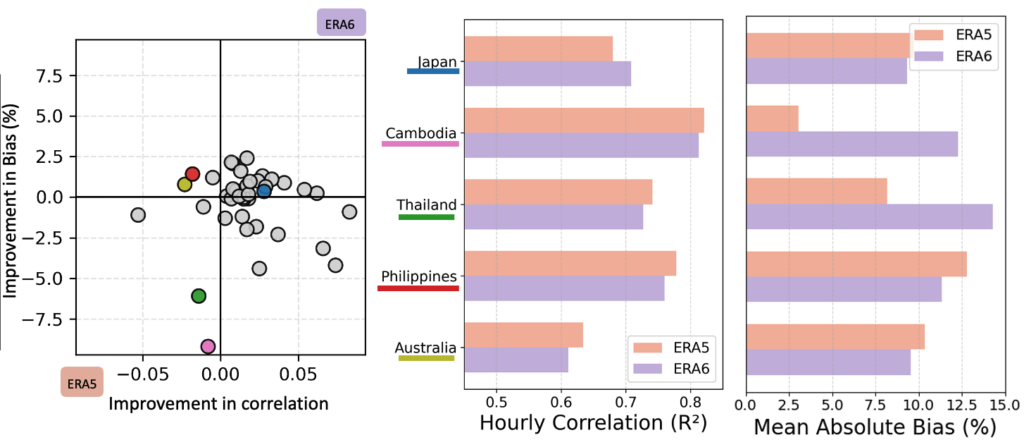
In Southeast Asia, Cambodia and Thailand stand out as outliers, with significantly higher bias in ERA6 and lower correlation.
The rest of the countries show modest improvement in bias, with Japan being the only country to also show better correlation.
