Close


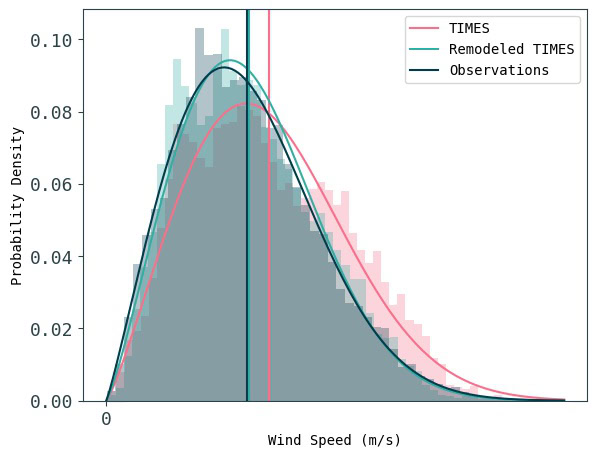
In wind energy projects, obtaining precise and reliable wind resource data is crucial, yet the available data often remains limited in both time and space. To extend this data into the long term, integrating real-world measurements with model results becomes essential. This study demonstrates the process of improving modelled turbulence using observational data and calibrating high-resolution time series (Vortex TIMES), based on data from a single site in New Zealand (specific location and quantitative results are kept confidential). The calibration refers to Vortex’s unique remodelling methodology, designed to enhance the accuracy of the model by aligning it with actual measurements. The figures presented correspond to the out-of-training period, which represents a timeframe without measured data, illustrating how calibration influences the model’s performance

More specifically, the metrics show a significant improvement in all the metrics after remodelling the TIMES. The most notable improvement is seen in speed standard deviation, where the bias decreased dramatically from 7.08% to just 0.04%. Since turbulence intensity is often defined as the ratio of the standard deviation of speed to the mean speed, a more precise standard deviation leads to a more reliable ratio. This enhances our confidence in the turbulence intensity estimation.
| Metrics | Wind Speed | Wind Direction | Standard Deviation of Speed |
|---|---|---|---|
| TIMES Mean wind speed bias (%) | +15.31 | 8.88 | 7.08 |
| TIMES Remodelled Mean wind speed bias (%) | +1.22 | 2.44 | 0.04 |
| TIMES RMSE (10-min) | 2.59 m/s | 29.95º | 0.46 m/s |
| TIMES Remodelled RMSE (10-min) | 1.98 m/s | 28.16º | 0.38 m/s |
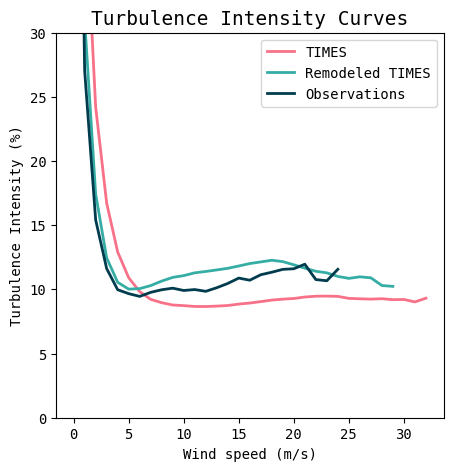
The following figure shows turbulence intensity as a function of wind speed, providing valuable insights into the calibration’s impact. The introduction of real-world measurements results in a significant alignment between the modelled and observed turbulence trends across varying wind speeds. This adjustment enhances the model’s accuracy, ensuring that it better represents how turbulence fluctuates under different wind conditions. This step is particularly crucial for optimizing wind farm design, where an accurate understanding of turbulence intensity is vital for both performance and durability.

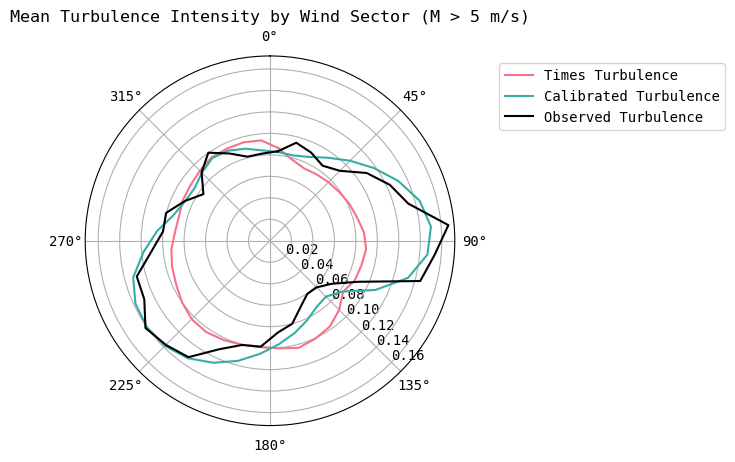
The figure below, presented as a polar plot, analyzes turbulence intensity (as a fraction of one) in relation to wind direction. Before calibration, there were significant discrepancies between the modelled and observed data, particularly in certain wind sectors. However, post-calibration, these discrepancies are greatly reduced, leading to a model that captures not only wind speed and turbulence more reliably but also the directional variability of turbulence. This enhancement is crucial for areas with complex wind patterns, as directional turbulence can significantly affect turbine wear and energy output.

Calibrating high-resolution time series data (Vortex TIMES) using real-world measurements can significantly enhance data accuracy for wind resource assessments. The study shows improved representation of wind speed distributions and turbulence patterns.
The out-of-training validation highlights how well this methodology performs. Calibration led to improved alignment between the remodelled Vortex TIMES (high-resolution time series) and observed wind conditions, ensuring more accurate representations of typical and extreme wind speeds. Particularly in turbulence, calibration reduced the speed standard deviation bias from 7.08% to 0.04%. Since turbulence intensity is defined as the ratio of the standard deviation of speed to the mean speed, a more precise standard deviation leads to a more reliable ratio, making the remodelled Vortex TIMES far more reliable for real-world applications. By accurately capturing turbulence variations across wind speeds and directions, the calibrated time series becomes a valuable tool for wind farm design and turbine maintenance planning.
In conclusion, the study validates that integrating real-world data to calibrate modelled high-resolution time series significantly strengthens the accuracy and predictive power of wind assessments.
Modeled wind resource data for the wind industry.
At any site around the world. Onshore and offshore.