
Close
In our previous post, we explored what it means to fit a Weibull distribution to wind speed data, and how the two key parameters, A (scale) and k (shape), may vary across different sites. Once you have these parameters… what next?
Why do wind resource assessment teams use the Weibull Distribution?
How can it be used to approximate the power production?
In this article, we’ll explore the mathematical properties behind the Weibull Distribution and show how these parameters allow you to estimate everything from mean wind speed to average wind power density, with clear formulas and Python snippets so you can try it yourself.
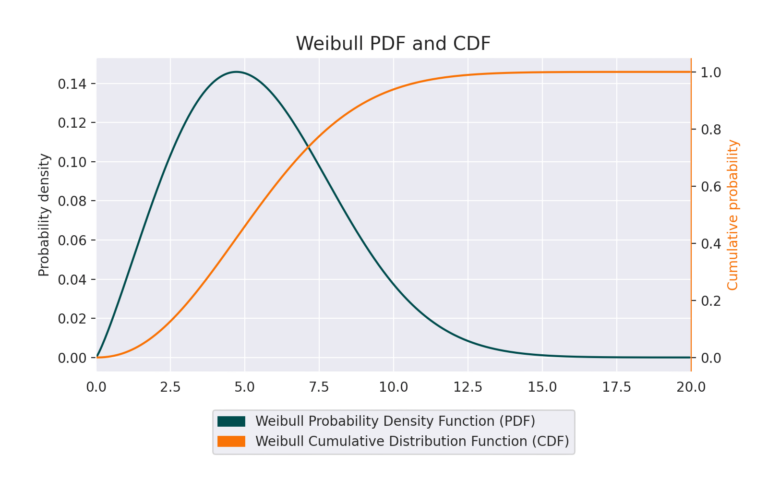
The Weibull function is a probability density function defined by two parameters with a shape that closely resembles the wind speed histogram at many places around the world.
A: the scale parameter
k: the shape parameter
The formula that describes the Weibull wind distribution is:
and the cumulative distribution, that describes the probability of observing a wind speed lower than x, is:
The Weibull parameters provide a compact way to describe the wind speed distribution — or at least, our best approximation of it. With just these two values, we can derive key statistical properties such as the mean wind speed, quantiles, and variance of the wind resource.
| Property | Formula | Python Code |
|---|---|---|
| Mean Wind Speed | A · Γ(1 + 1/k) | from scipy.special import gamma |
| Median Wind Speed | A · (ln 2)1/k | median_ws = A * np.log(2)**(1/k) |
| Wind Speed Quantile (p ∈ [0,1]) | A · [−ln(1 − p)]1/k | quant_p_ws = A * (-np.log(1 - p))**(1/k) |
| Mode (most frequent wind speed) | k > 1: A · [(k − 1)/k]1/k k ≤ 1: 0 | if k > 1: |
| Variance | A² · [Γ(1 + 2/k) − (Γ(1 + 1/k))²] | from scipy.special import gamma |
| n-th Moment | An · Γ(1 + n/k) | from scipy.special import gamma |
The Wind Power Density (WPD) is the total kinetic energy of the wind per unit time and area (measured in W/m² ). Its formula is the following, where ρ is the air density is typically considered 1.225 kg/m³, and v is the wind speed (in m/s). It can be computed at each instant and will depend on the air density and wind speed at that particular moment in time.
If we don’t have the wind time series and we only know its distribution, we can estimate the average wind power density by assuming that the air density is constant and computing the “average value of the wind cubed” (v³), which in mathematics is known as the third moment of the wind.
WPD = ½ · ρ · v3
In python, we would compute the mean wind power density using:
from scipy.special import gamma

mean_wpd = 1 / 2 * density * A**3 * gamma(1 + 3/k)
Any wind turbine has a range of wind speeds between which it can operate. If the wind speed is lower than the cut-in wind speed (vo), the turbine does not operate (around 3-4 m/s), and if it is higher than the cut-off (vo) wind speed they also stop before risking damage (around 25 m/s). The rated wind speed (vr) is where the turbine can already generate the nominal power.
The turbine will be operating at nominal power for wind speeds between the rated and cut-off values. Using the Weibull distribution, we can compute the probability of operating at nominal power as:
In python, we would compute this probability by using:
import math

p_max_power = math.exp(-(v_rated / A)**k) - math.exp(-(v_cutoff / A)**k)
Let’s practice, put your hands on the Weibull
Say you’re told a location has a Weibull distribution with A = 6.5 and k = 2.0.
The mean wind speed is 5.76 m/s
The standard deviation: 8.69 m/s
The median (where half the time the wind is slower, half the time faster): 5.41 m/s
The 25% quantile (wind is slower than this 25% of the time): 3.49 m/s
The 75% quantile (wind is faster than this 25% of the time): 7.63 m/s
And how strong can the wind get?
Since the Weibull curve technically stretches to infinity, there’s no “maximum”, but we can look at high quantiles instead:
95% quantile: 11.25 m/s
99.9% quantile: 17.08 m/s
Insight: With just A and k, you’ve sketched a full statistical portrait of the wind, from typical behaviour to rare extremes.
We will assume a standard air density of 1.225 kg/m³. The average wind power density is 223.6 W/m².
Modeled wind resource data for the wind industry.
At any site around the world. Onshore and offshore.