
Close
The Turkana Channel in Kenya is known for its powerful nocturnal low-level jet (LLJ) winds. LLJs are a natural phenomenon that funnels air masses between the Ethiopian and Kenyan Highlands, which creates one of Africa’s premier wind energy hotspots. At the core of this region stands the Lake Turkana Wind Power Station, which remains one of the continent’s largest wind farms and consistently supplies approximately 11% of Kenya’s electricity demand.
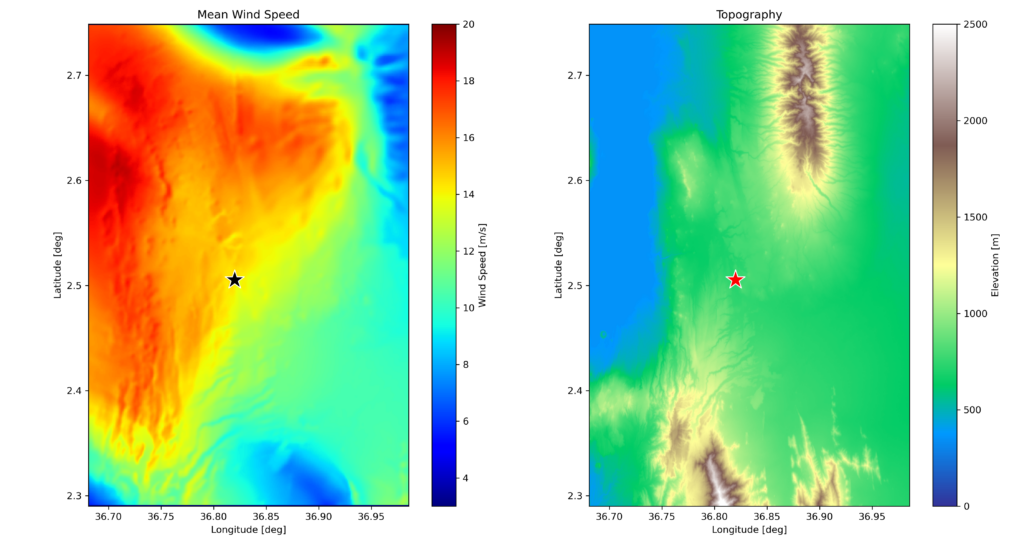
But what drives this wind resource, and how can advanced modeling techniques enhance its utilization? To address these questions, detailed atmospheric and site analyses have been conducted, including modeling of a 1,729 km² area and high-resolution time series data at latitude 2.63°N and longitude 36.69°E (Figure 1).
A LLJ is a non-logarithmic wind speed profile characterized by a distinct local maximum (often called the jet core or nose) in the lower atmosphere. This non-ideal profile significantly impacts the performance and durability of wind energy systems, influencing wind turbine power production, wind turbine power production, wake recovery, and structural/aerodynamic loading.
LLJs typically form due to geographical or atmospheric forcing, including orographic channeling (wind being funneled by terrain), katabatic (downslope) winds, or the development of an elevated inversion layer that is part of the diurnal wind cycle.
The jet was first described in scientific literature by Kinuthia and Asnani (1992) based on measurements collected in Marsabit, Kenya. Their observations revealed intense wind speeds at altitudes between 200 m and 500 m above ground, with peak activity occurring between 00:00 and 06:00 UTC. Subsequent observations from the 2021 RIFTJet campaign recorded an average low-level maximum wind speed of 16.8 m/s around 03:00 local time (LT). Atmospheric reanalysis like ERA5 often underestimates observed winds by as much as 33% (Munday et al., 2022). Moreover, direct measurements provide the most reliable estimates but remain limited in both spatial and temporal coverage. For this reason, high-resolution mesoscale wind data have been analyzed in this study to better characterize the jet’s dynamics and variability.
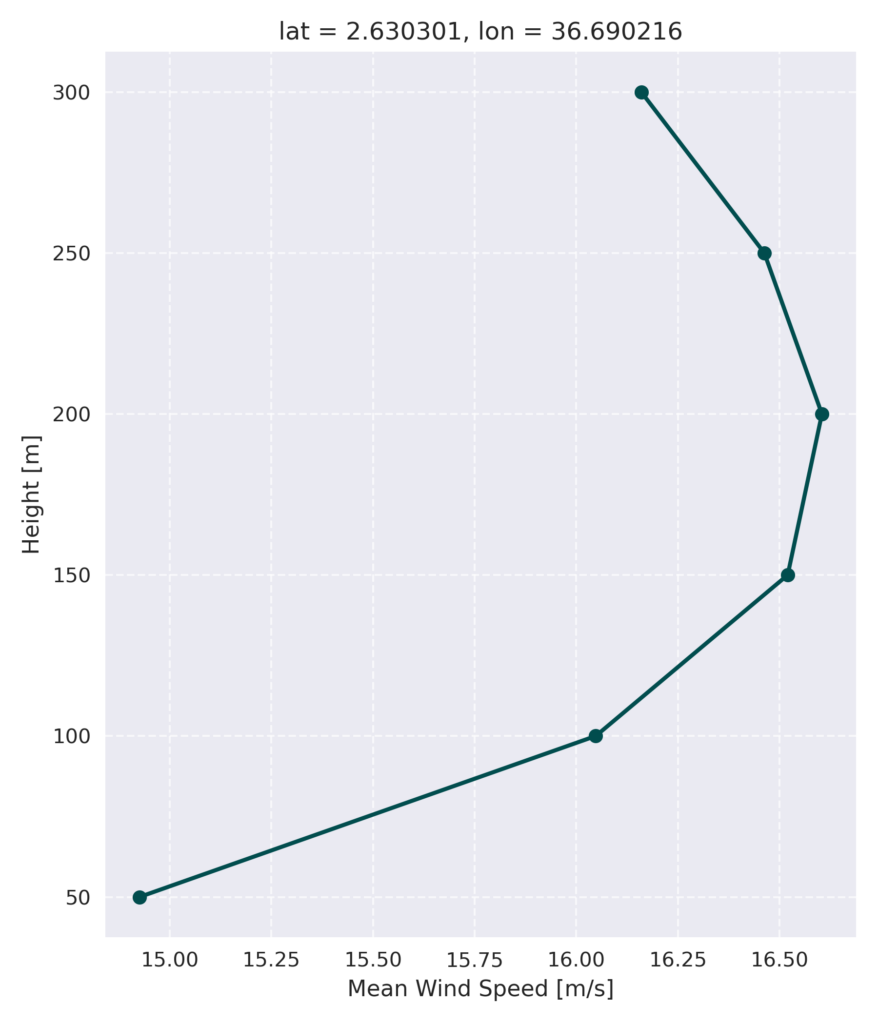
Figure 2 shows the modeled mean wind speed profile for the selected location in the Turkana Channel area. The profile peaks at around 200 m height, reaching approximately 17 m/s. But why?
During the day, surface heating generates boundary-layer turbulence and increased friction. This turbulence mixes momentum vertically, which slows the jet circulation and flattens the wind speed profile. At night, the development of a stable nocturnal boundary layer decouples the air aloft from surface friction. This inhibits the upward mixing of momentum, allowing winds to accelerate significantly (Munday et al., 2024).
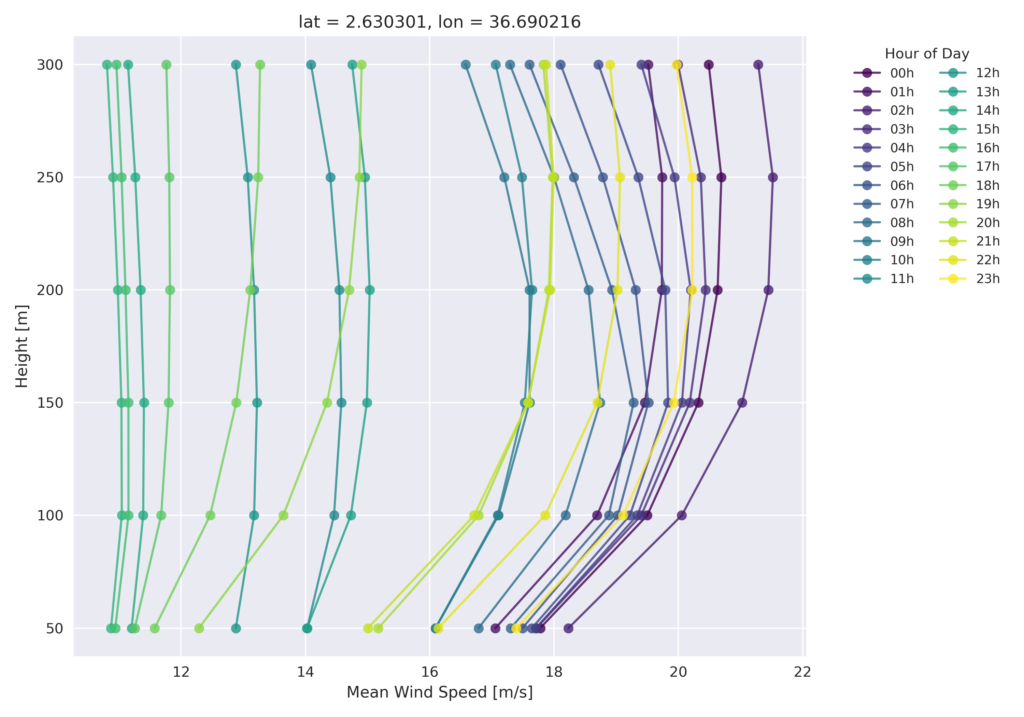
LLJs typically form under specific atmospheric conditions, and their intensity varies throughout the day. For wind energy applications, mean wind speeds remain substantial across the diurnal cycle, indicating favorable wind resource potential.
The LLJ exhibits a pronounced diurnal pattern, with the strongest winds occurring at night and the weakest during the day. Several studies, including observations from the RIFTJet campaign (Munday et al., 2022), have confirmed this behavior.
Atmospheric stability is classified using the Richardson Number (RI), a measure of turbulence based on wind shear and temperature gradients. According to He et al. 2024, the categories are listed in Table 1.
| Very Unstable | RI < -0.05 |
| Unstable | -0.05 ≤ RI < 0 |
| Near-neutral Unstable | 0 ≤ RI < 0.01 |
| Neutral | 0.01 ≤ RI < 0.05 |
| Near-neutral Stable | 0.05 ≤ RI < 0.25 |
| Stable | 0.25 ≤ RI < 1.0 |
| Very Stable | RI ≥ 1.0 |
As observed before, atmospheric stability conditions are associated with inversions in the vertical wind profile. LLJs are one of the phenomena where such inversions occur. The site’s stability distribution on Figure 4 reveals a high frequency of stable conditions, which favors the formation of LLJs and promotes laminar flow.
Stability can be computed using the Richardson number between two levels; however, this means it may vary across the vertical scale. This represents a key distinction between using the bulk Richardson number (RI) and the Monin–Obukhov length (RMOL) for characterizing stability.
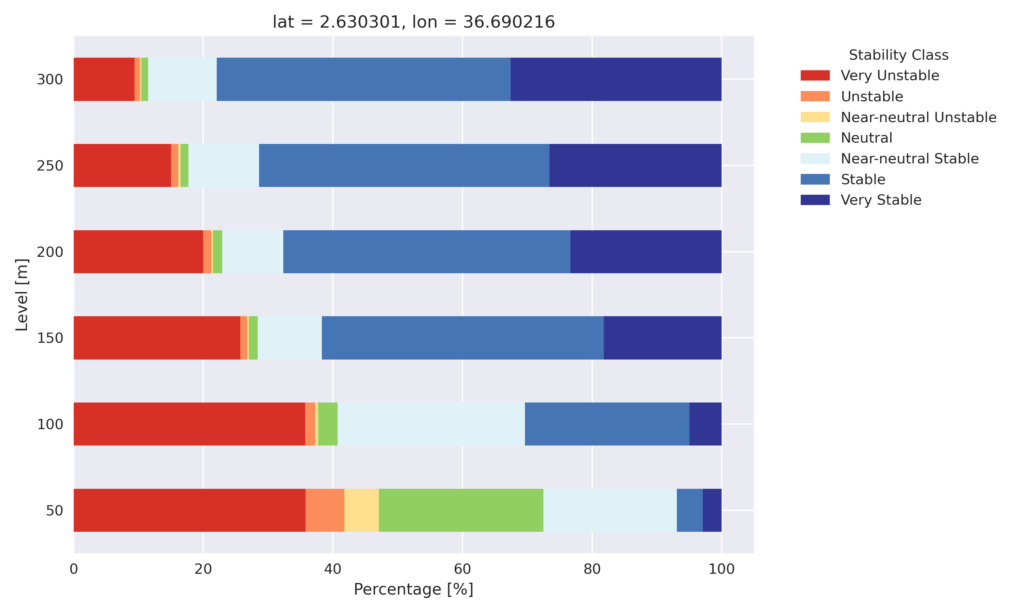
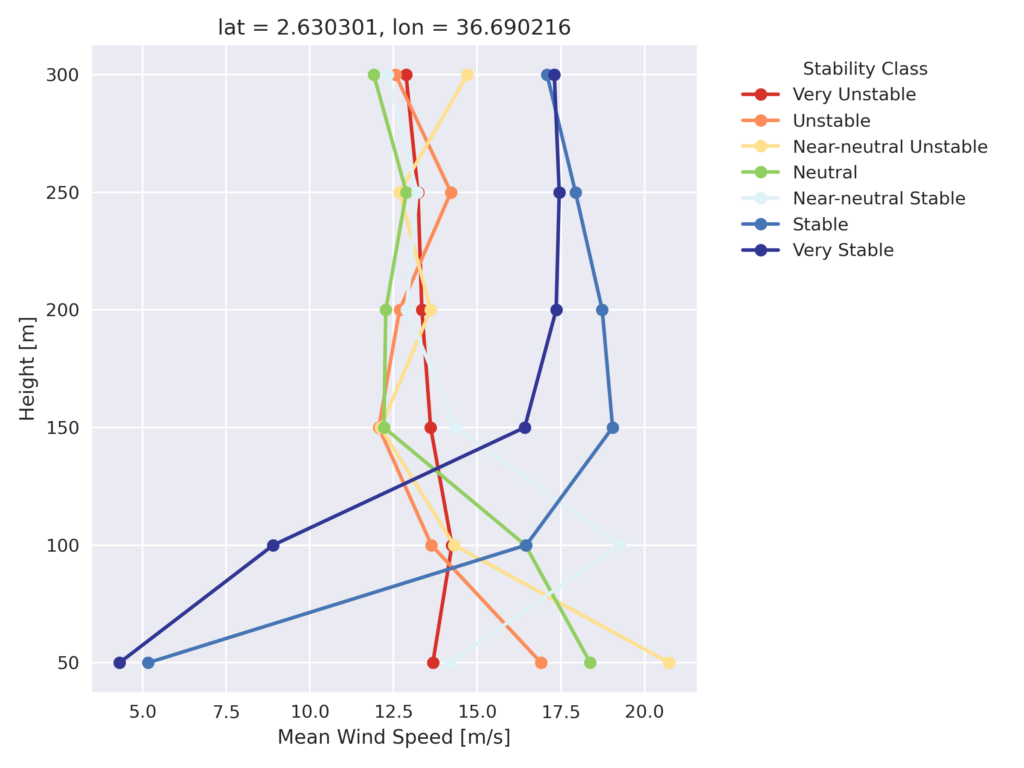
The analysis in Figure 5 reveals that stable conditions dominate in the upper part of the profile, while unstable layers prevail near the surface. The data paints a clear picture: under very stable conditions, wind speeds reach around 19 m/s at 150–200 m, whereas during very unstable periods they drop to about 13 m/s. The diurnal cycle reinforces this behavior — nighttime stability enhances wind speeds, while daytime instability and turbulent mixing weaken the flow.
Results demonstrate that Vortex BLOCKS effectively detects and characterizes the Turkana Channel Low-Level Jet across different heights, times of day, and stability conditions at the chosen site.
This approach not only improves understanding of the physical drivers behind one of Africa’s strongest wind corridors but also provides actionable insights for optimizing turbine layout, predicting energy yield, and planning future wind developments in complex terrain.
In order to study this phenomenon, we simulated a 1729 km² area—defined by coordinates (2.290000, 36.680919), (2.748638, 36.680919), (2.748638, 36.985474), and (2.290000, 36.985474)—using Vortex’s BLOCKS. With a 100 m spatial resolution and 365 days, BLOCKS blends mesoscale and microscale modeling to deliver 30-min wind data over two years at multiple heights (50–300 m). This granularity improves coarser reanalyses like ERA5.
Modeled wind resource data for the wind industry.
At any site around the world. Onshore and offshore.