
Close
At Vortex, we know that trust in wind resource data is the foundation of successful wind energy projects. Accurate wind data is crucial for assessing new wind farm sites or optimizing existing ones, impacting performance and profitability. To ensure reliability, we rigorously validate our high-resolution modeled wind data against real-world observations using industry and scientific-standard metrics.
But how can you know if modeled wind data is accurate enough? What should you look for when reading a validation report? In this article, we show you how to interpret key metrics so you’re not misled by the way values are presented.
Modeled wind resource data, generated using advanced numerical tools like the Weather Research and Forecasting (WRF) model, estimates wind speeds where direct measurements aren’t available. Validation compares these estimates to actual observations, ensuring they’re trustworthy for:
Note that these comparisons assume measurements are accurately taken and representative of actual site conditions.
The main types of metrics used to validate the wind speed are:
Metrics are computed for each site and hub height, then aggregated across multiple sites to assess the model’s overall performance.
| Domain | Metric (units) |
| Time Domain |
|
| Distribution Domain |
|
These metrics assess how well the model reproduces the temporal evolution of wind speed at each site.
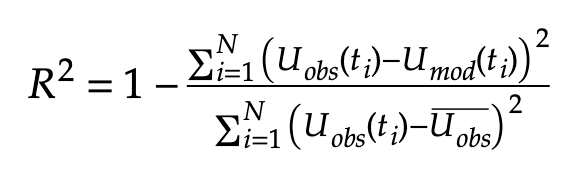
Correlation metrics quantify the degree to which temporal patterns in modeled wind speed time series 𝑈𝑚𝑜𝑑(𝑡𝑖) align with those in observed data 𝑈𝑜𝑏𝑠(𝑡𝑖), where N is the number of timestamps. Fraction of the variance in observations explained by the model, from 0 (none) to 1 (perfect).
| Aggregation | Meaning |
| 10-min | Model skill at high frequency/turbulence |
| Hourly | Diurnal cycles and short-term events |
| Daily | Daily mean variability |
| Monthly | Seasonal climatology |
Daily correlations are typically higher than hourly but lower than monthly. In regions with no seasonal cycle, monthly correlations may appear low, but this does not necessarily indicate poor model performance, as this metric may not be appropriate for such areas.
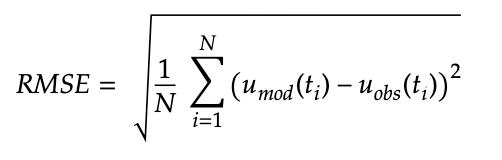
The Root Mean Squared Error (RMSE) in m/s captures the average magnitude of prediction errors, providing a direct measure of how closely the model replicates observed values at each timestamp 𝑡𝑖.
| Aggregation | Meaning | Typical use |
| 10-min | Instantaneous/turbulent variability | Turbine-scale validation |
| Hourly | Diurnal cycles and short-term events | Operational forecast validation |
| Daily | Synoptic-scale weather patterns | Meteorological timescale analysis |
| Monthly | Seasonal climatology | Long-term resource validation |
Example: 𝑅𝑀𝑆𝐸 = 1.5 𝑚/𝑠 suggests that, on average, the model deviates from the actual wind speed by approximately ±1.5 m/s at any given timestamp.
These metrics evaluate how well the model reproduces the observed wind speed distribution, which directly affects energy yield calculations.
The bias is the average relative difference in % between modeled and observed wind speed. Measures systematic deviation in mean wind speed.

When aggregated across multiple sites (N), the mean bias indicates whether the model has a systematic tendency to over- or underestimate.

The absolute bias in % is the average unsigned deviation between modeled and observed mean wind speeds. Provides the typical magnitude of error, without sign cancellation (absolute value).

When we summarize performance across multiple sites or periods, the mean absolute bias reflects the overall magnitude of the model’s error.

At Vortex, we don’t use the “Mean Absolute Error (MAE)” because it can generate confusion with the “Mean Absolute Bias (MAB).” Both metrics are mathematically similar in form but represent different concepts: MAE measures instantaneous errors over all timestamps (time- domain), while MAB represents the mean-level error across sites or periods (distribution- domain).
Wind speed histograms are often fitted to a Weibull distribution defined by:
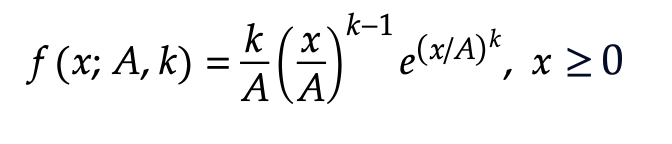
Where:
Absolute Bias in % is computed for each parameter, quantifying how accurately the model reproduces the scale (A) and shape (k) of the observed wind distributions.
The Earth Mover’s Distance (EMD) in m/s validates how different wind speed distributions are; the minimum amount of “work” needed to transform one distribution to another.

Where 𝐹𝑚𝑜𝑑 and 𝐹𝑜𝑏𝑠 are the cumulative distribution functions (CFDs) of the modeled and observed wind speeds.
EMD = 0 (identical distributions). Larger EMD means greater mismatch in both the mean and shape of the wind speed histogram, being more robust than comparing Weibull fits.
In wind data validation, bias and error can be reported in units (m/s) and percentages (%). This can lead to misleading conclusions, especially when comparing sites with different wind conditions.
Errors in % are normalized when we compare multiple sites and wind regimes.
Aggregate results across multiple sites (equal weight).
Reflect physical relevance for energy yield.
Consistency across metric validation.
For example, a bias of 1 m/s at a site with an average wind speed of 5 m/s means a 20% error, which is quite large. At a site with 10 m/s average wind speed, the same 1 m/s bias is only a 10% error. If you only look at the bias in m/s, without adjusting it to the average wind speed, you can’t fairly compare different sites. That’s why, in wind analysis, it’s better to express the bias in percentage. Using only values in units can hide how impactful model errors are.
| Validation goal | Recommended metrics |
| Mean wind speed accuracy |
|
| Wind distribution fidelity |
|
| Temporal pattern skill |
|
| Overall error magnitude |
|
Modeled wind resource data for the wind industry.
At any site around the world. Onshore and offshore.