Aggregating Wind Time Series for Wind Resource Assessment
By Marta Gil-Bardají
In the wind industry, wind speed historical data are used by the resource assessment teams to study the wind potential of a site and estimate the power that could be generated by wind turbines. Depending on the level of depth of the analysis, wind data can take the form of:
This article will explore the definition of Weibull fit and what do the two parameters, A and k, mean. We’ve computed the Weibull fit at 300 sites around the world, and we will show the range of A and K values that can be expected in the real world.
There’s one country that consistently shows higher k values compared to the rest. Can you guess which country it is?
WEIBULL DISTRIBUTION
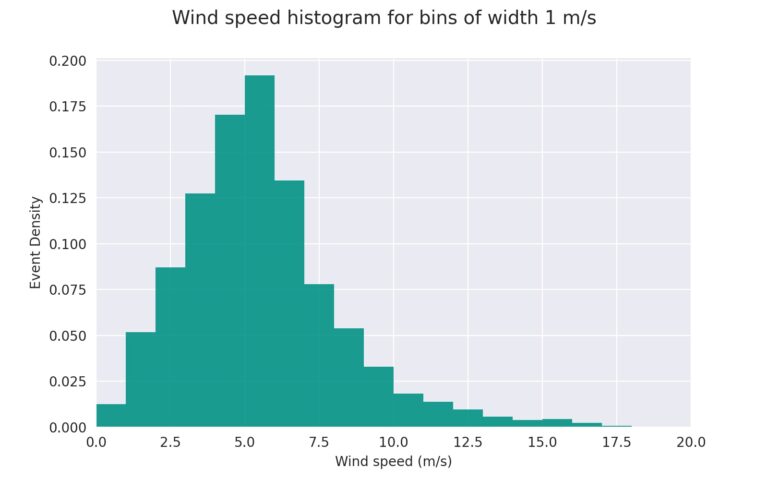
The information about the frequency of occurrence of certain wind speed events is captured by the histogram, also called the wind distribution. To compute a histogram, one must fix the bin edges that define how wide the intervals of wind speed values are that we count together. The smaller the bin width, the more details about the wind speed distribution can be appreciated. Typically, bin widths of 1m/s or 0.5m/s are used. However, when using the Weibull distribution, this histogram can be fit into a continuous probability distribution that provides a more concise representation of wind conditions over time.
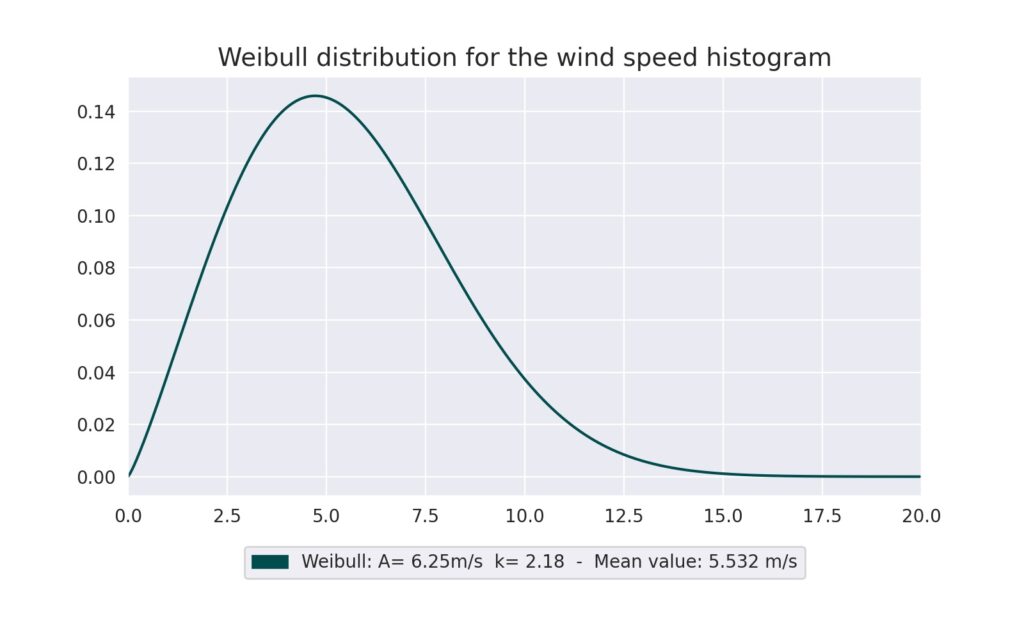
The Weibull Function is a probability density function defined by two parameters (A and k) with a shape that closely resembles the wind speed histogram at many places around the world.
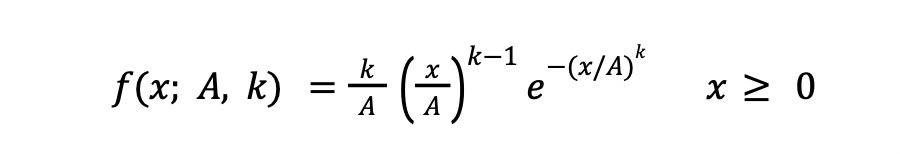
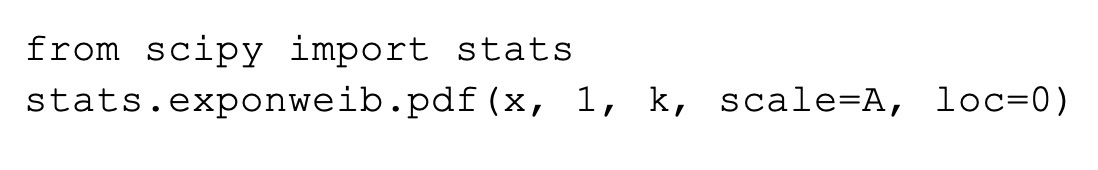
The formula that describes the Weibull wind distribution is shown below. In Python, the Weibull probability function is a special case of the exponentiated Weibull continuous random variable. To compute the event density at a wind speed 𝑥 for a wind described by the Weibull parameters 𝐴 and 𝑘, we would use the corresponding formula, as displayed next to it.
THE WEIBULL FIT PARAMETERS
The Weibull Function is a probability density function defined by two parameters (A and k) with a shape that closely resembles the wind speed distribution. Therefore, instead of having to use the event density of each wind speed bin (~30 values), we can represent the (approximate) wind distribution using only the two weibull parameters. These two parameters are used because they define a function that closely resembles the wind speed distribution at many places around the world, and are very useful to deduce properties of the wind histogram without having to handle explicitly the event population of each wind bin.
𝐴: scale parameter The scale parameter 𝐴 is measured in m/s and proportional to the mean wind speed. In statistics, this parameter can also be referred to as λ or η.
𝑘: shape parameter The shape parameter 𝑘 has no units and represents the spread of the distribution. For wind speed distributions, the value of k is usually around 2, ranging from 1 to 4.
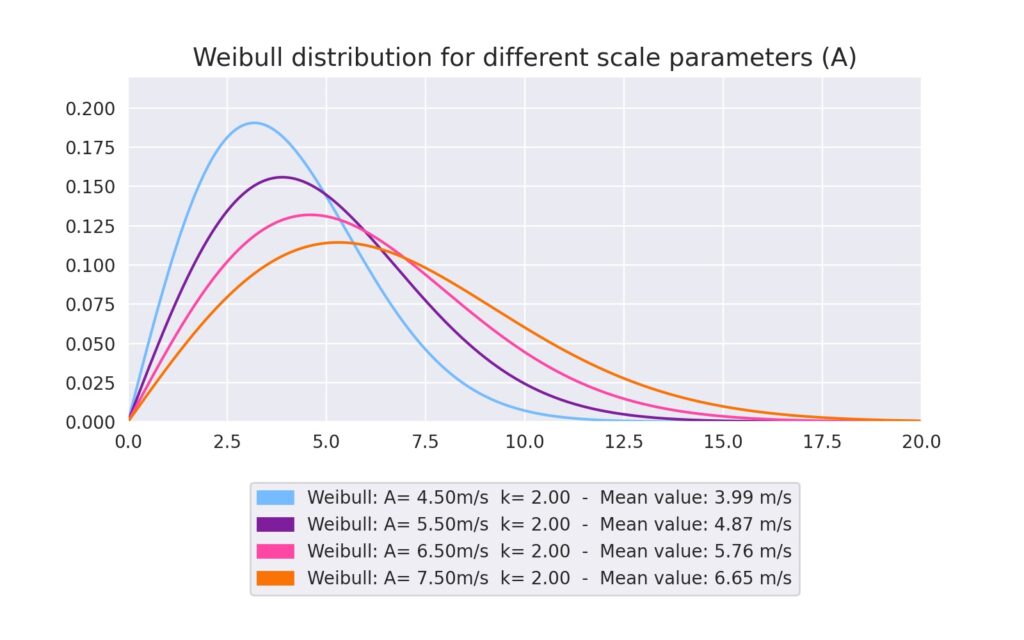
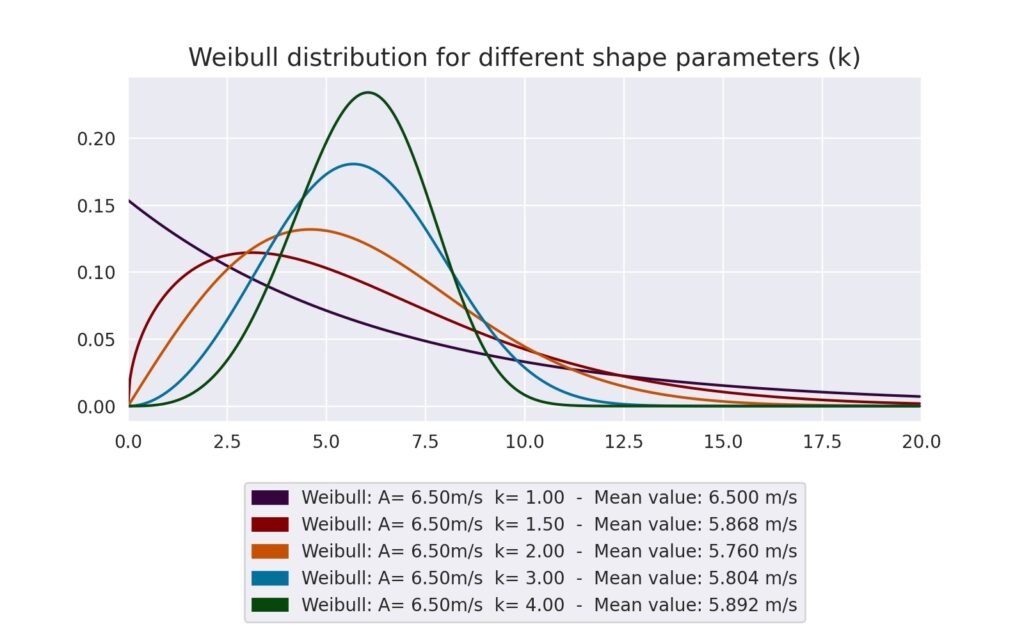
In the left plot, we can see different Weibull functions with the same value of k=2 and increasing A. For a lower A, the histogram is narrower and centered at lower wind speeds, whereas for a higher A, the histogram is wider and higher wind speeds are more likely. In the right plot, we can see different Weibull functions with the same value of A=6.5m/s and increasing k. For k lower than 1, the distribution is decreasing and does not describe a wind distribution. For small k, the frequency of lower winds increases sharply and there is a gradual decrease of high wind speed frequency, with a thick tail for high wind speed events. Mathematically, it is said that the distribution is right-skewed. When k is 3, the shape approximates a normal distribution (bell shape) and for even larger k, the distribution is left-skewed.
REAL WORLD EXAMPLES
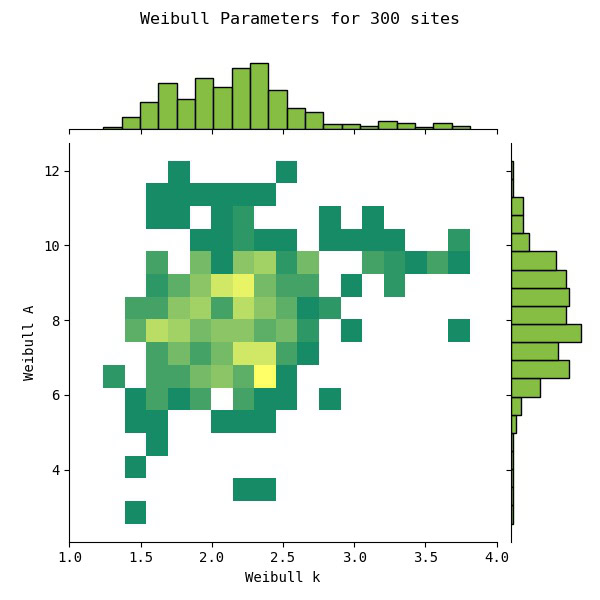
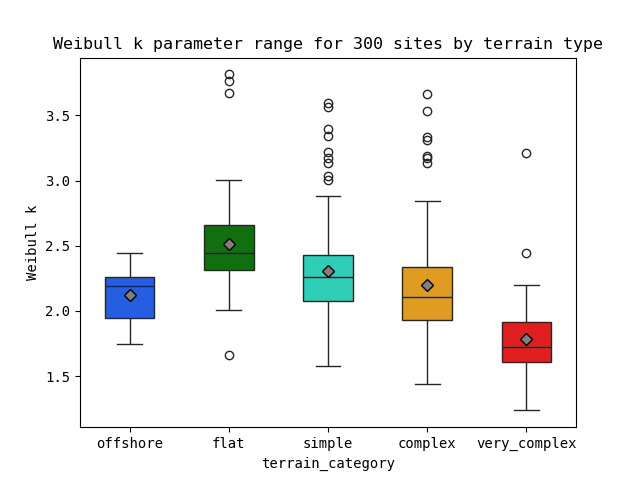
For 300 sites around the world, we have computed the wind distribution and the Weibull fit for a certain measurement period (generally greater than one year). Usually, the value of the Weibull k parameter is around 2 and the Weibull A parameter is a bit higher than the mean wind speed of the time series. On the following plots we can see how are the Weibull parameters distributed in our sample sites, and how the k parameter depends on terrain complexity:
Let’s see some examples.
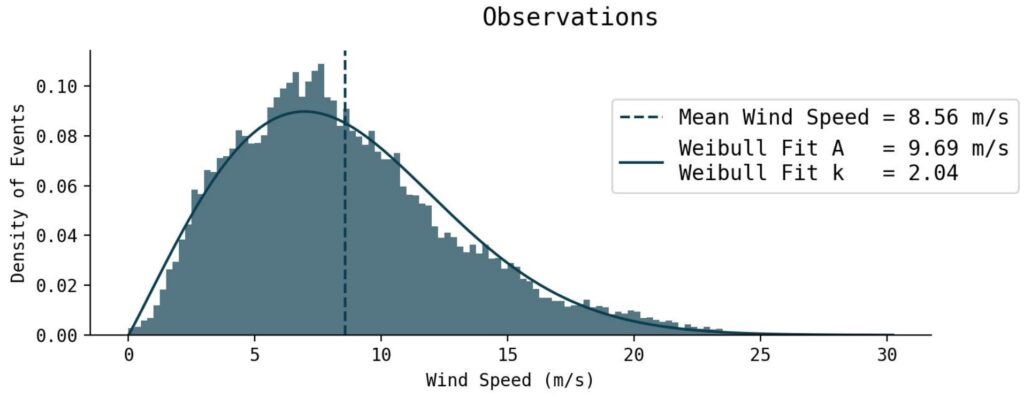
1. Typical k value: Typical wind distributions have a k parameter from 2 to 2.5.
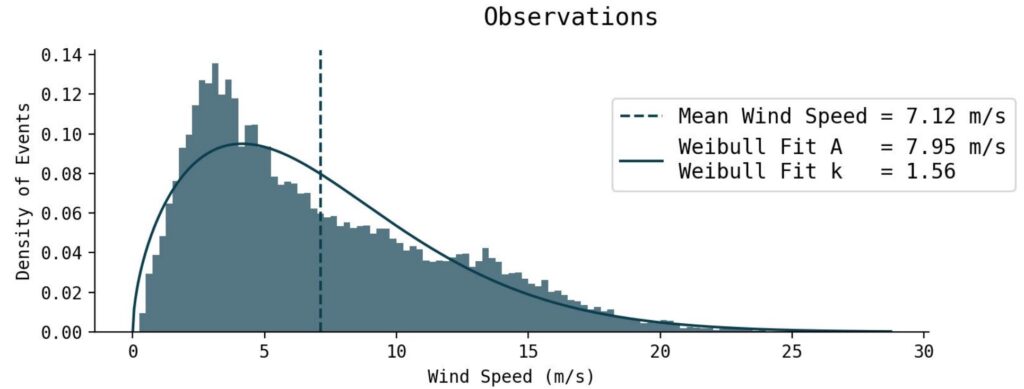
2. Small k value: Weibull fits with a smaller k are strongly right-skewed and feature longer tails.
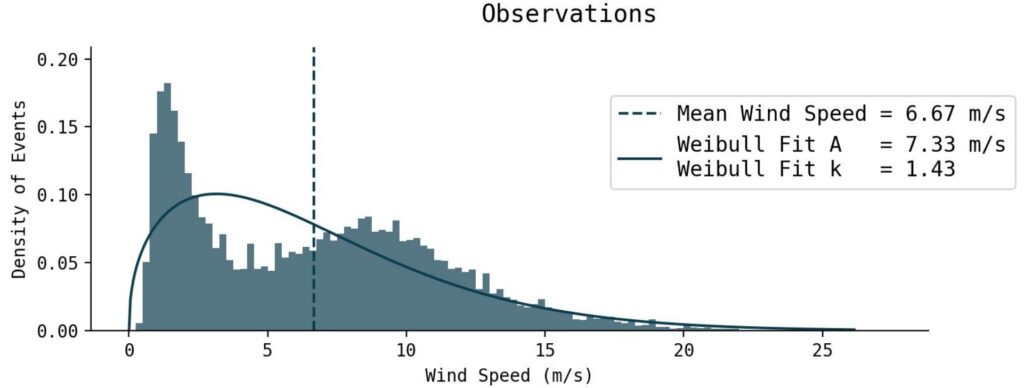
It is uncommon to obtain k values around 1.5, and in those cases one should be careful to check that the Weibull fit is actually a good description of the wind histogram. For example in the right plot case any Weibull fit that we try to adjust to the wind distribution will be a poor description.
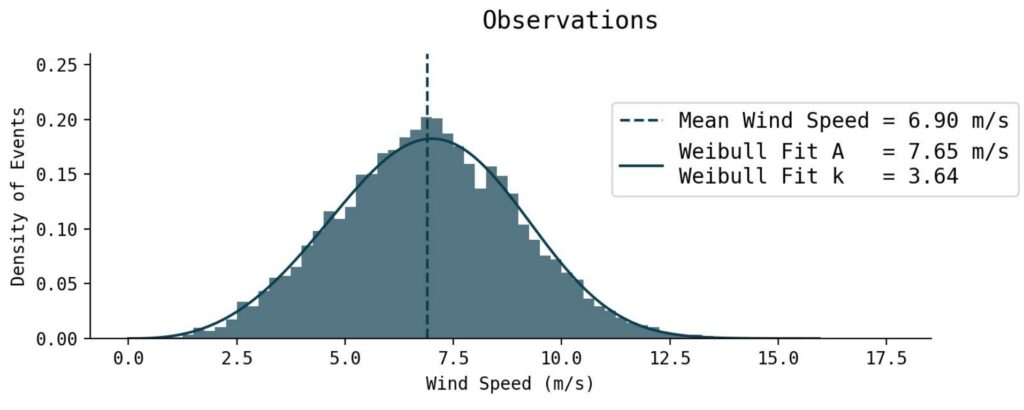
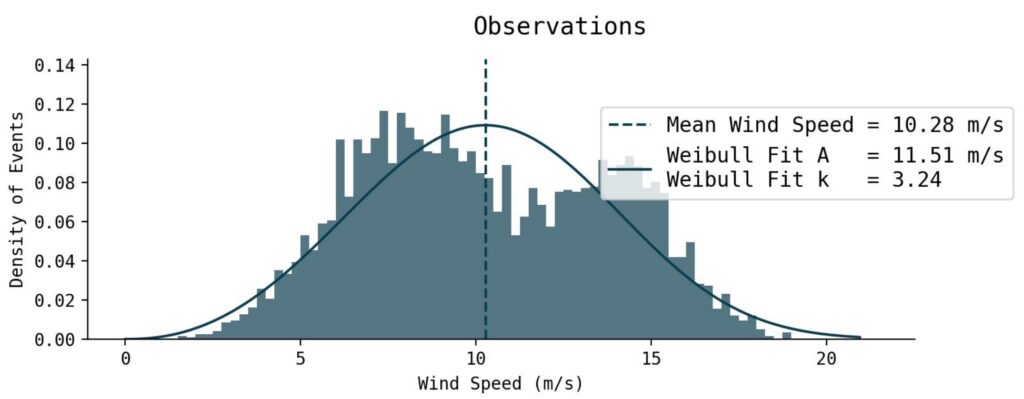
3. Large k value: Some locations have a k value higher than 3, and therefore the distribution is left-skewed, with an uncommon low frequency of small wind speed values. Curiously, the vast majority of sites with a k value higher than 3 are located in Brazil.
Like with lower k values, sites that have a high k value can frequently be bimodal (right plot) and therefore, the Weibull fit cannot be used directly.
TAKEAWAYS:
The Weibull distribution provides a simplified method for characterizing wind speed patterns. By fitting wind speed data to the Weibull distribution, we can effectively summarize the wind distribution using just two parameters: scale (A) and shape (k).
The scale parameter (A) is proportional to the mean wind speed and helps estimate the typical wind conditions of a site. The shape parameter (k) reflects the distribution’s spread, with values around 2 being typical for most sites.
The Weibull parameters can vary based on local terrain and wind conditions, with k values often influenced by terrain complexity. Some countries like Brazil exhibit wind distributions with high k values, and while sometimes these fits correctly describe the shape of the wind distribution, most times it means the underlying distribution is not actually following a Weibull shape.
While the Weibull fit works well for most wind sites, it’s important to recognize that extreme or unusual wind patterns, such as those with bimodal distributions, may require additional analysis beyond the standard Weibull fit.