Close

By Pep Moreno.
Although the word may be a little frightening, hysteresis is a well-known effect meaning that behaviour under a change in external conditions is not symmetrical over time in the sense that it may vary depending on the “history” of the change.
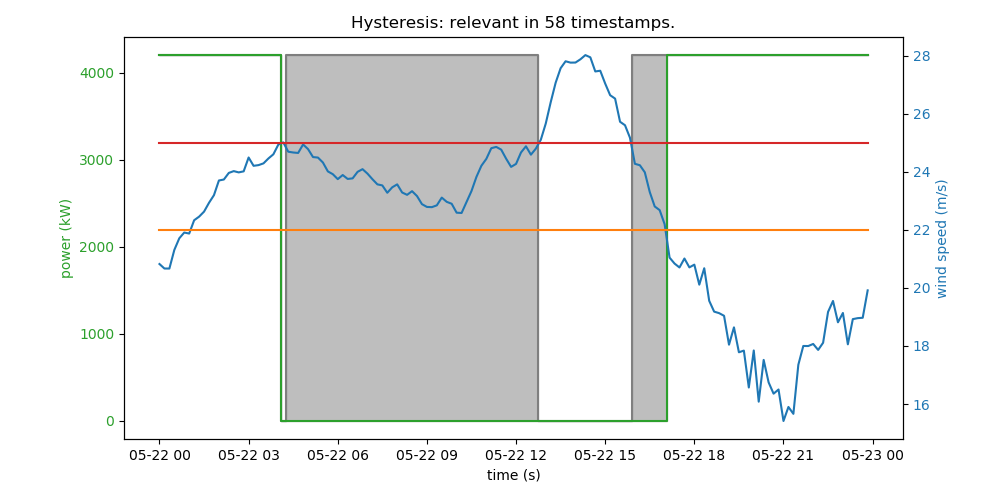
Applied to wind turbines, this term refers to the different behaviours of the machines when their cut-off wind speed is reached after higher or lower winds. In the header plot, the turbine (green line) stops when the wind (blue) increases to 25m/s (red) but it does not start again until it lessens to 22m/s (orange). The turbine is programmed in this way to avoid continuous start-stop sequences that would fatigue the turbine if wind fluctuates around a fixed cut-off speed.
In the above plot, grey zones refer to “loses” produced between 25 and 22m/s during hysteresis periods. Such loses are only accountable if AEP is computed in the Time-Domain since the usual Frequency-Histograms algorithms consider usable winds all those with speeds lower than 25m/s regardless of whether they come after higher or lower wind speeds.
Internal Vortex analysis indicates that the latter may result in AEP overestimations of up to 2% on windy sites. This may be a secondary effect in the analysis but is easily avoidable by computing production with wind Time-Series, in what we foresee as the next standard in Wind Resource calculations.

Modeled wind resource data for the wind industry.
At any site around the world. Onshore and offshore.