Close

This text presents a case study of a wind resource site in Brazil with complex topography and unique wind distribution characteristics. Unlike typical sites where the windiest areas are near the highest points, this site’s wind distribution doesn’t align with its topography. The study focuses on how to identify climate characteristics related to this phenomenon, especially for early project development in similar Brazilian sites.
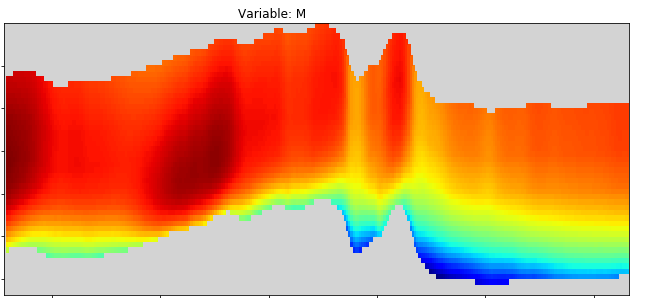
In the case study, the site has a complex topography with predominant eastward wind flow. The wind resource area has an abrupt slope in the east, gradually decreasing in height toward the west, creating a significant obstacle to the wind flow. Initial measurements using a single met mast near the hilltop showed variations in maximum wind speeds, with different models suggesting max speeds at different heights. To assess this situation, various model data were generated and compared. Three simulation technologies were employed and compared against measurements from seven locations. High-resolution mesoscale models provided additional data for understanding site phenomena. Gathering such information early in project development is crucial for adjusting measurement campaigns to ensure an accurate evaluation of wind flow and turbulence.
In early-stage wind resource assessments, both mesoscale and CFD models are commonly used. These models have their own strengths and weaknesses, which often become apparent when met mast data is available. A single met mast can help assess model bias, but it falls short in evaluating the overall wind field distribution.
To evaluate wind distribution across the site, multiple met masts placed in different locations within the area are employed. In this scenario, the consistency of wind speed increases across the met masts indicates a reliable wind resource field. When both the model’s spatial distribution and met mast measurements are well-matched, it significantly reduces uncertainties in wind resource assessments.
Conversely, relying solely on a low-bias model at a single location can lead to erroneous conclusions. Assessing a single point in a model with incorrect wind spatial distributions results in significant errors in speed increases. Therefore, it is vital to develop techniques and gather data to identify areas susceptible to such discrepancies
This study seeks to conduct a thorough evaluation and performance comparison of three distinct wind models: Vortex BLOCKS, WASP, and Reynolds-averaged Navier-Stokes Computational Fluid Dynamics (RANS-CFD) model. Each model has been employed to generate the wind field for the entire area, encompassing all met masts. We’ve used met mast data A as input for each model. In the case of Vortex, met mast data A has been used to calibrate the original mesoscale wind field, which is initially generated without wind measurements. By comparing different models and assessing their performance against met masts, we can gauge how the site’s evaluation behaves under varying conditions.

In general, both CFD setups and WAsP produce similar results, with WAsP being a bit better. Notably, Vortex is good at catching western wind acceleration but sometimes predicts too high wind speeds 3 km to the left of the ridge. An alarm for these phenomena may be triggered in areas characterized by steep slopes and instances where models predict unusual wind speeds over topography. Deviations in temperature from the anticipated linear increase with height above sea level can also serve as an indicator.
For more details about the results download the full document here.
Modeled wind resource data for the wind industry.
At any site around the world. Onshore and offshore.