
Close

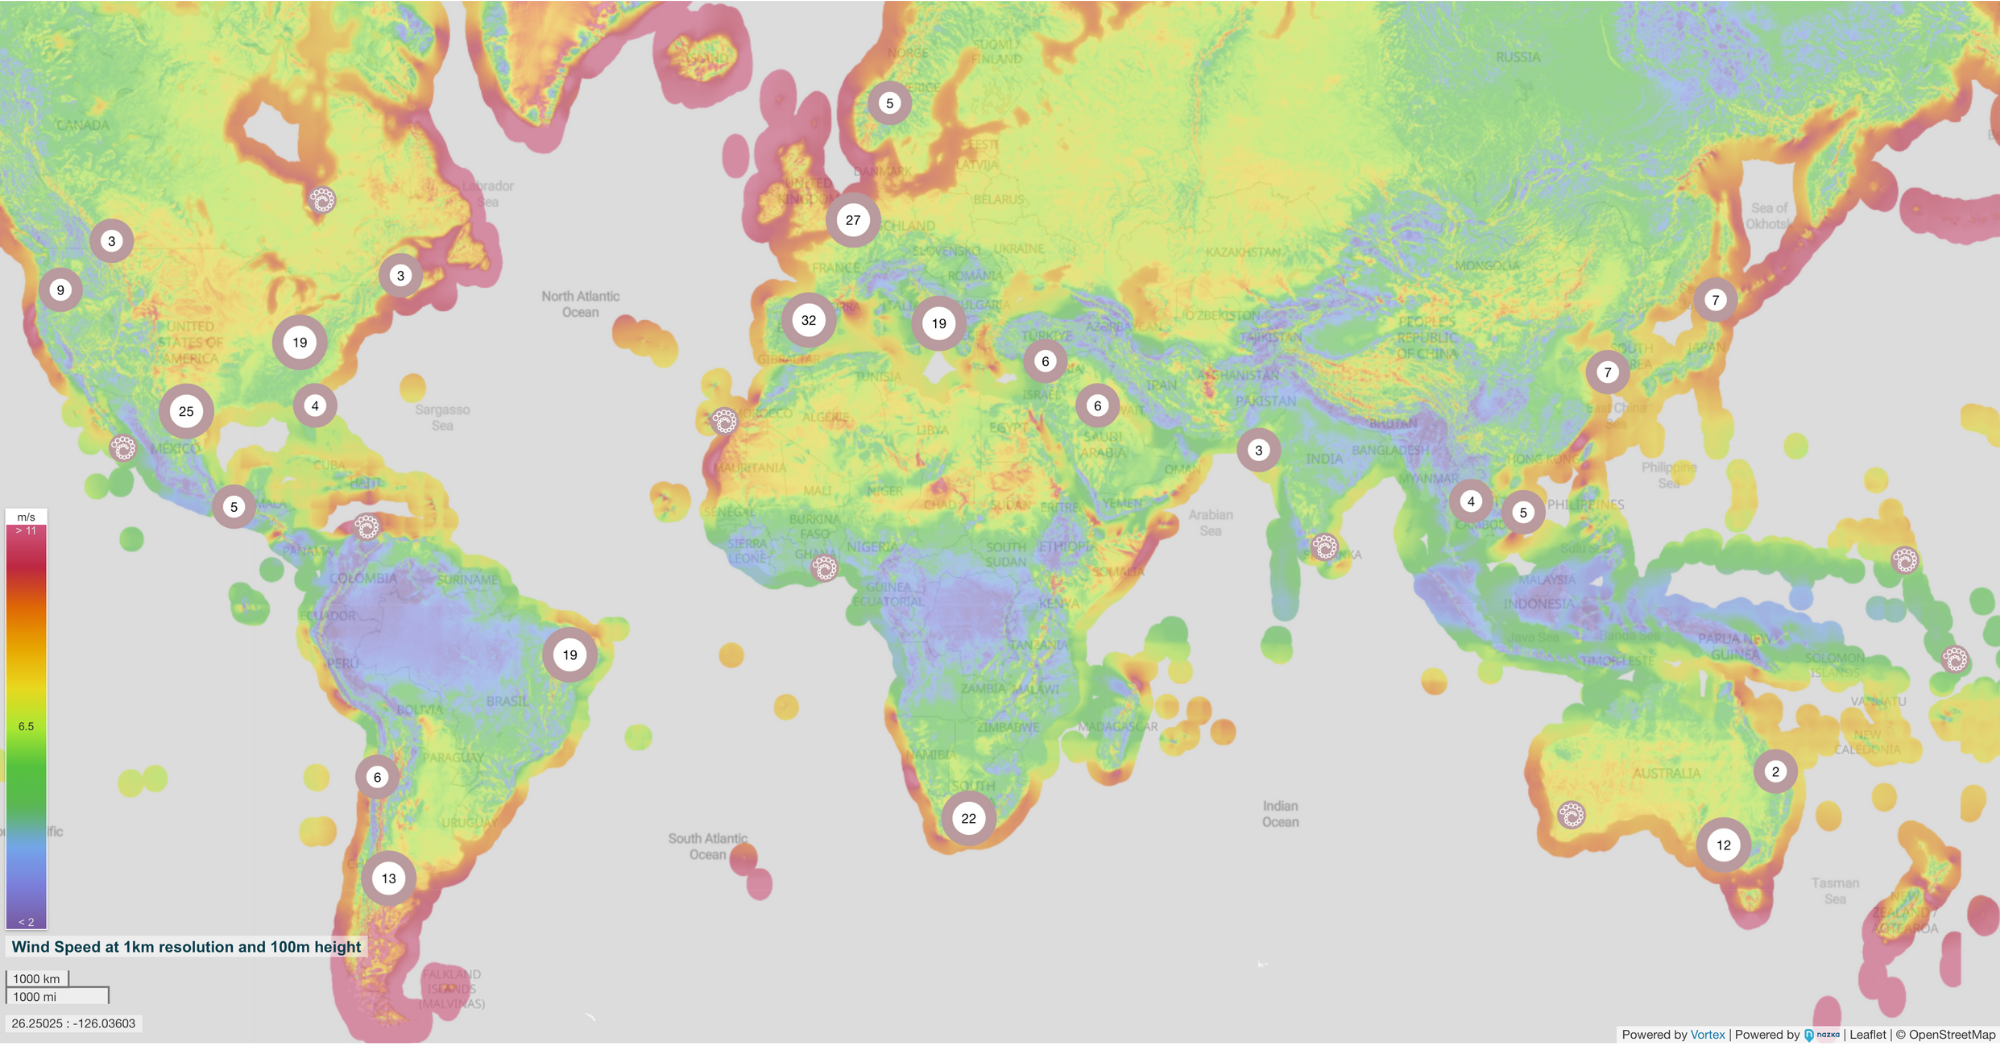
This is the fifth post in the TIMES Series, where we break down everything about Vortex TIMES. In this one, we’ll try to give you insight into the validation our team conducted. We focused on assessing wind speed accuracy, variability, and correlation, including validation of turbulence intensity where possible, as well as the vertical wind speed profile. Check out other posts in the series from the table of contents here.
Upon the launch of Vortex TIMES, our team conducted a comprehensive global validation spanning over 272 sites. Our primary focus was to assess the accuracy, variability, and correlation of wind speed, incorporating validation of turbulence intensity where available, along with the vertical wind speed profile.
This extensive study covered 272 sites (regions with consistent terrain complexity, typically containing one or more measurement towers), including 307 mast locations (towers equipped with instruments for measuring wind speed and direction. Data frequency, instrumentation, and heights vary) and a total of 359 points (measurements taken at various heights on a single mast location). Utilising datasets from both publicly available sources and private company contributions dedicated to this validation, we aimed to provide a precise assessment of TIMES uncertainty. To enhance the depth of our analysis, results were categorised by terrain complexity, allowing for a detailed site-by-site examination.
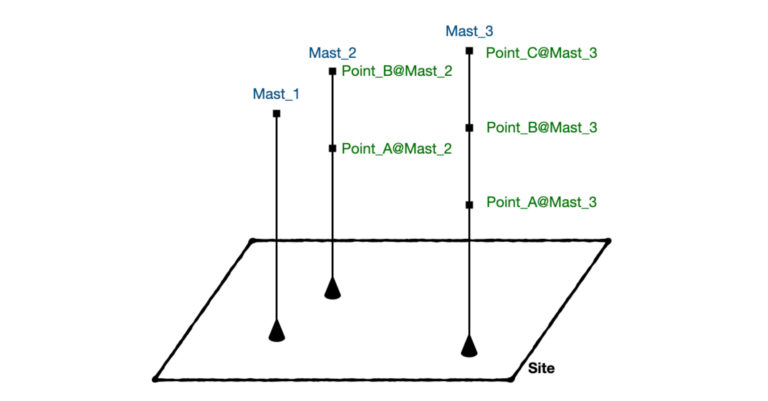
With an abundance of data at our disposal, we validated various outputs and variables from Vortex TIMES. The majority of measurements were based on hourly data, with a resampling technique extending validation to a total of 359 points. The analysis covered key variables and metrics, including mean wind speed, wind distribution, wind speed on coarser time scales, wind rose, and wind direction, each assessed with specific metrics such as RMSE, Correlation, and Absolute Bias.
Additionally, using 181 points with 10-minute data, we validated the main output—10-minute time series for wind speed. Metrics such as 10-min RMSE, 10-min Correlation, 10-min wind direction RMSE, and 10-min wind direction correlation were employed.
Wind standard deviation measurements were available at 101 points, facilitating validation for various metrics such as Absolute Bias, Bias, EMD, 10-min RMSE, 10-min Correlation, and Turbulence Intensity.
Validation of extreme events with a 50-year return period (Vref) was conducted using a Gumbel Fit, encompassing 30 points with over 5 years of data. Metrics included Vref50 Absolute Bias and Vref50 Bias for maximum wind speed.
Finally, our study delved into 10-min ramps, power spectral density (PSD), wind seasonal/diurnal cycles, wind interannual variability, vertical structure, and mean vertical profiles.
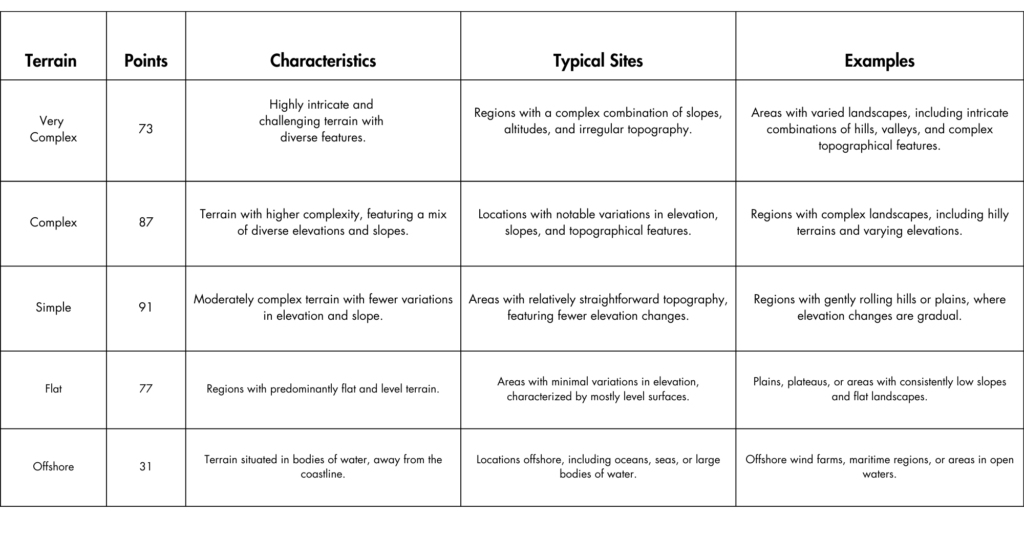
Sites were classified based on terrain complexity using a specially designed Terrain Complexity Index (TCIX), considering the range and deviation of slope and terrain height in the surrounding area. Onshore sites were categorised as flat, simple, complex, and very complex based on increasing TCIX values.
The figure below presents a breakdown of terrain categories across different continents, sorted by complexity: Very Complex, Complex, Simple, Flat, and Offshore. This organised presentation enhances our understanding of terrain complexity, providing insights into the prevalence of different terrain types across continents.
Additionally, the elevations for each terrain category are represented by different levels (points) in the provided table.
This breakdown offers insights into the diverse elevations associated with each terrain category, showcasing the distribution of points across different elevation levels within each category.
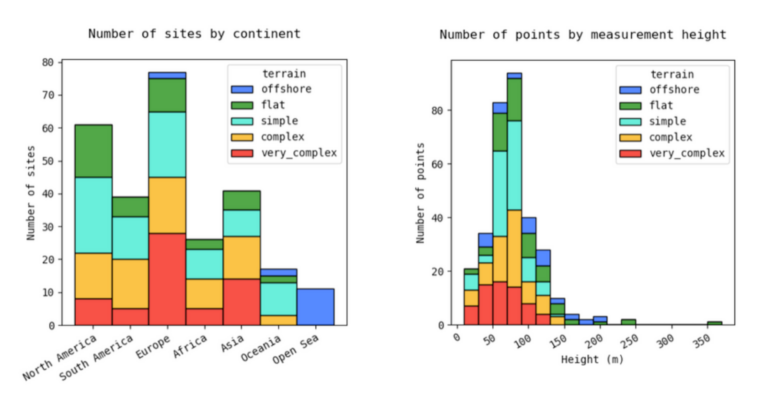
A general view of the validation for the main metrics by terrain categories. On the left, is the number of points of each terrain type. On the right, three box plots of the absolute bias of the mean wind speed (in percentage units), the correlation and the root-mean-square error (RMSE) for the 5 terrain types.
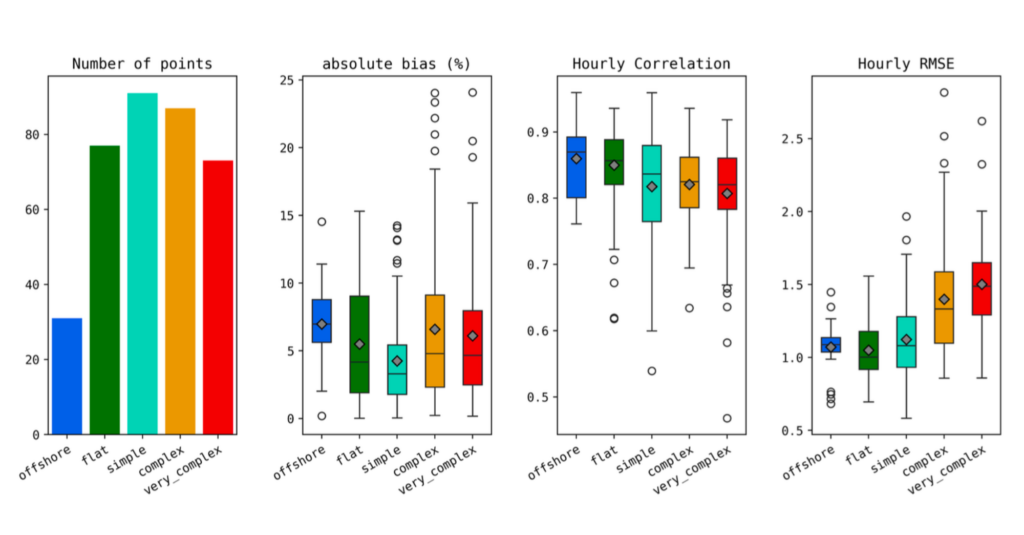
Figures and metrics from TIMES-Technical-Details-and-Validation_Nov23 document. link
Thank you for joining us on this validation overview of TIMES data. If you have any questions or need further assistance, feel free to contact us.
Stay tuned for more insights. Explore the entire series here. Your feedback drives our commitment to advancing atmospheric modeling with Vortex TIMES. For pricing options, you can either contact us directly or sign up for a free account on our Vortex Interface.
We are open to suggestions about other topics that can be added to the analysis, leave your comments below:
Modeled wind resource data for the wind industry.
At any site around the world. Onshore and offshore.