Close


This is the first of the posts in the TIMES Series, a series of blog posts dissecting and explaining everything about Vortex TIMES. In this post, we broadly describe the TIMES dataset and summarize the practical details on submitting and downloading it from the Vortex Interface.
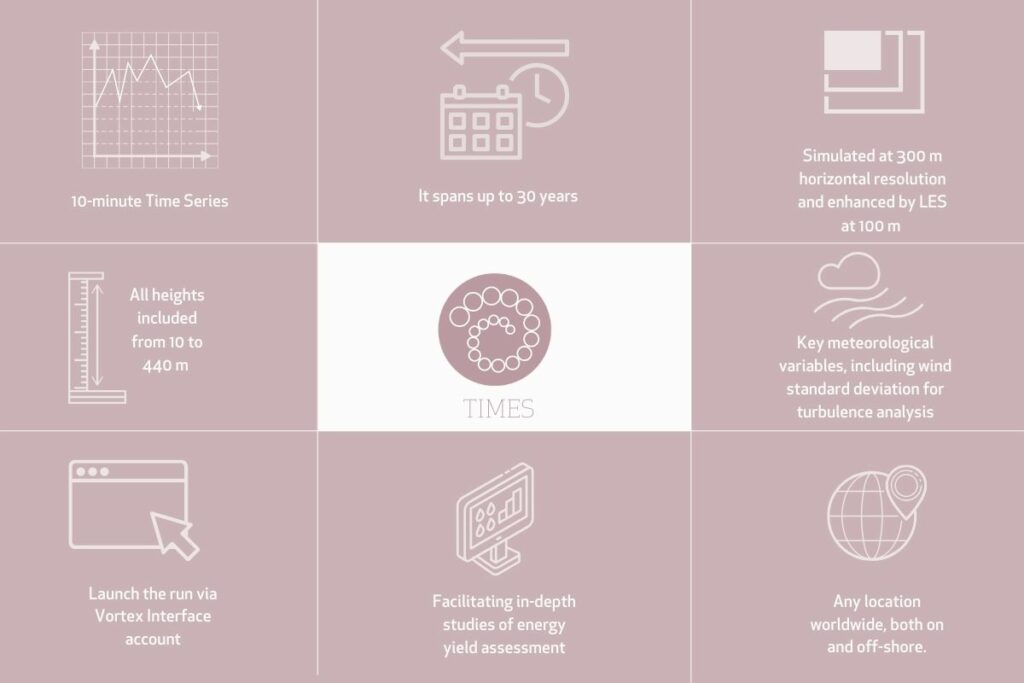
Vortex TIMES is a comprehensive wind dataset that offers a long-term, high-resolution 10-minute time series specific to a particular location. It includes a range of meteorological variables relevant for wind resource assessment, including wind standard deviation. TIMES spans up to 30 years, covering heights from 10 to 440 meters above ground level.
TIMES unveils the full potential of modeled time series, empowering in-depth energy yield assessment studies that significantly reduce uncertainty in estimates. This dataset simplifies evaluations of site variability and offers invaluable insights into the interrelationships of variables such as turbulence, shear, atmospheric stability, and more.
A baseline simulation of the Weather Research and Forecasting (WRF) model, which doesn’t explicitly resolve microscale features, is conducted for the entire period. Data is stored at 10-minute intervals during this simulation. This baseline is then augmented by a shorter high-resolution microscale Large Eddy Simulation (LES) simulation. The LES simulation enhances the accuracy of wind distribution, turbulence intensity, and sub-hourly variability in the data.
Vortex TIMES has been thoroughly validated using data from more than 270 sites worldwide, which cover different types of terrains and weather conditions. In this study, we didn’t just look at wind speed; we also checked additional parameters critical for accurate wind resource assessment and the optimization of wind farm design. We’ve summarized our findings in two reports, one shorter and simpler, and the other longer with more technical details. Moreover, in this series of blog posts we will dive into greater detail and discuss specific aspects of the validation. See the Overview post for a table of contents.
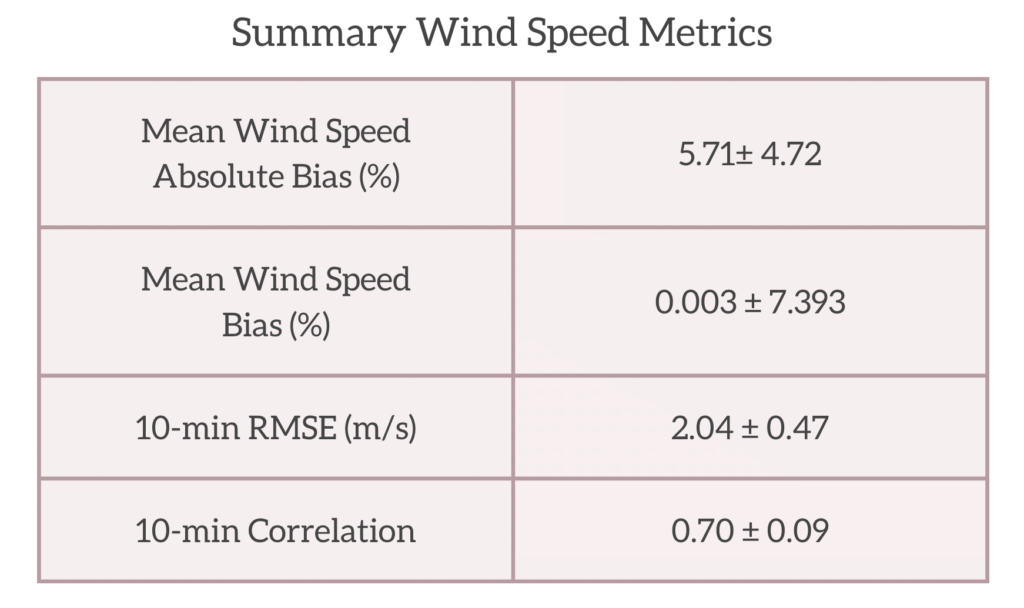
Here is a summary of the 4 most important wind speed metrics found in our validation.

Usability
TIMES can be launched using the Vortex Interface. After entering the coordinates and simulation period (10, 20 or 30 years), the TIMES simulation is submitted and added to the user’s queue. Once it starts, it takes between 4 and 6 days (depending on the simulation period) to be completed, and then the 10-minute time series can be downloaded at any height from 10 to 440 meters. They include the following variables:
Meteorological Variable | Units | Name of the Column |
Wind Speed | m/s | M(m/s) |
Wind Direction | degrees | D(deg) |
Wind Standard Deviation (useful to compute turbulence intensity) | m/s | SD(m/s) |
Temperature | degrees Celsius | T(C) |
Air Density | kg/m³ | De(kg/m3) |
Pressure | hPa | PRE(hPa) |
Richardson Number (Bulk RI computed between 10m above and 10m below the requested height) | (dimensionless) | RiNumber |
Relative Humidity | % | RH(%) |
Inverse Monin-Obukhov Length (variable related to atmospheric stability) | 1/m | RMOL(1/m) |
Vertical Wind Speed (to compute the inflow angle) | m/s | VertM(m/s) |
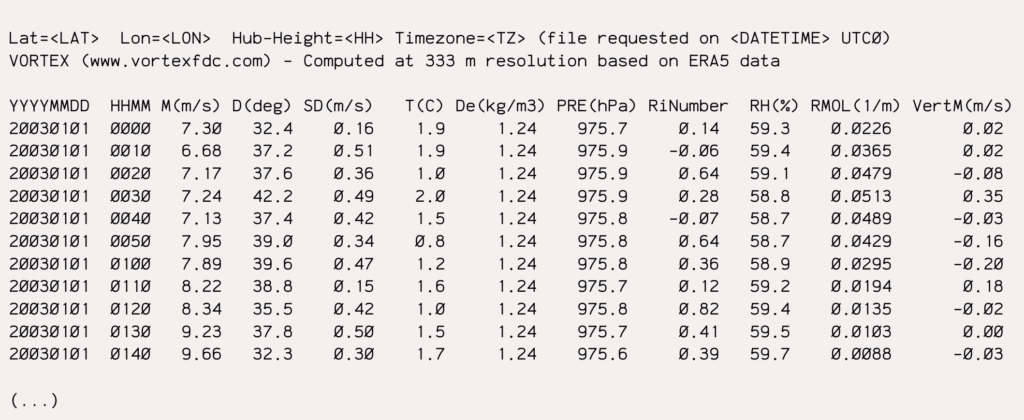
The series are delivered in text format, such as follows:

After adding TIMES to your portfolio, you have the flexibility to update it monthly, ensuring it aligns with the latest reanalysis release. This feature allows you to initiate a TIMES request during the wind farm prospecting phase and subsequently extend its use for long-term measurement correction. This streamlined approach enables the utilization of a single source of synthetic data throughout the entire wind resource assessment process, from green-field development to operational stages.
For pricing options, feel free to contact us.
We are open to suggestions about other topics that can be added to the analysis, leave your comments below:
Modeled wind resource data for the wind industry.
At any site around the world. Onshore and offshore.